JavaPerspective.com >
Intermediate Tutorials >
1. The Eclipse IDE >
1.3. Tips about Eclipse >
1.3.3. How to use the Eclipse debugger
1.3.3. How to use the Eclipse debugger
Last updated: 25 January 2013.
The Eclipse debugger allows you to halt the execution of a program at any point. When the program is halted, you can execute its statements step by step, inspect the variables and even change their values during the execution. In this tutorial, I am going to use a slightly different version of the class JavaLoops that you have seen in the tutorial The continue statement. The class JavaLoops is in the package com.javaperspective.tutorials.practice and it contains two methods:
- printOddNumbers prints the positive odd integers under 10 to the standard output.
- sayBye is a private method that simply prints Bye to the standard output.
package com.javaperspective.tutorials.practice;
public final class JavaLoops {
public void printOddNumbers(){
final int MAX_VALUE = 10;
for(int i=0; i<MAX_VALUE; ++i){
if(i % 2 == 0)
continue; // if i is an even number, jump to the next iteration
System.out.println(i);
}
sayBye();
}
private void sayBye(){
System.out.println("Bye");
}
}
public final class JavaLoops {
public void printOddNumbers(){
final int MAX_VALUE = 10;
for(int i=0; i<MAX_VALUE; ++i){
if(i % 2 == 0)
continue; // if i is an even number, jump to the next iteration
System.out.println(i);
}
sayBye();
}
private void sayBye(){
System.out.println("Bye");
}
}
The class App shown below is in the package com.javaperspective.tutorials and it contains a main method that calls the method printOddNumbers:
package com.javaperspective.tutorials;
import com.javaperspective.tutorials.practice.JavaLoops;
public final class App {
public static void main(String[] args) {
new JavaLoops().printOddNumbers();
}
}
import com.javaperspective.tutorials.practice.JavaLoops;
public final class App {
public static void main(String[] args) {
new JavaLoops().printOddNumbers();
}
}
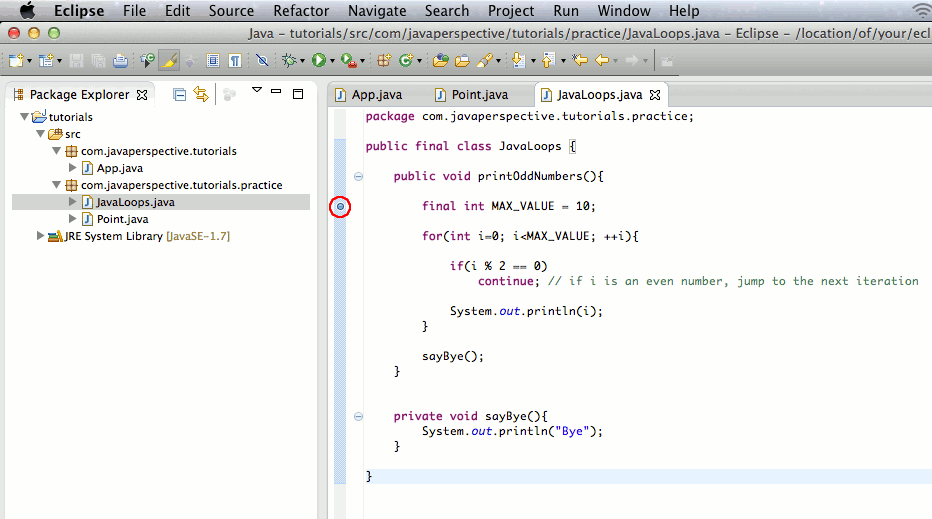
To be able to use the Eclipse debugger, you must add breakpoints at the locations where you want the execution to halt. To add a breakpoint, just double-click the left hand side edge of the editor. For example, the following picture shows a breakpoint outlined in red at the first statement of the method printOddNumbers:
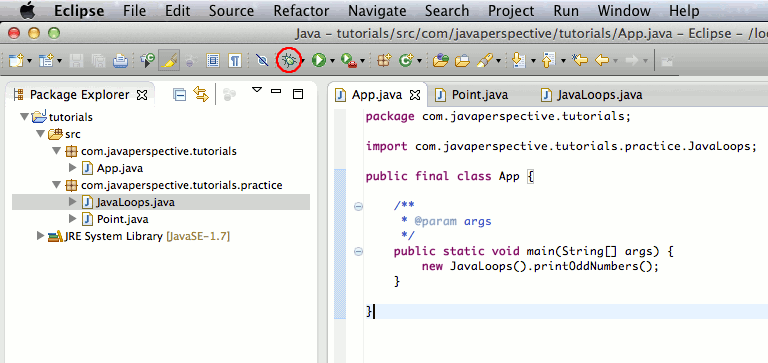
To start the debugger, open the class App containing the main method and click the button Debug. In the picture shown below, the button Debug is outlined in red:
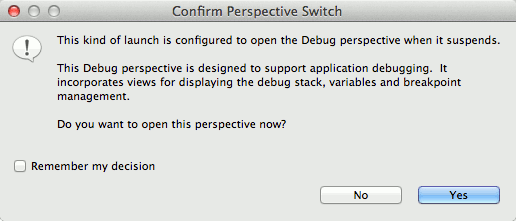
When you click the button Debug, the following dialog box is displayed. Click Yes to open the Debug perspective.
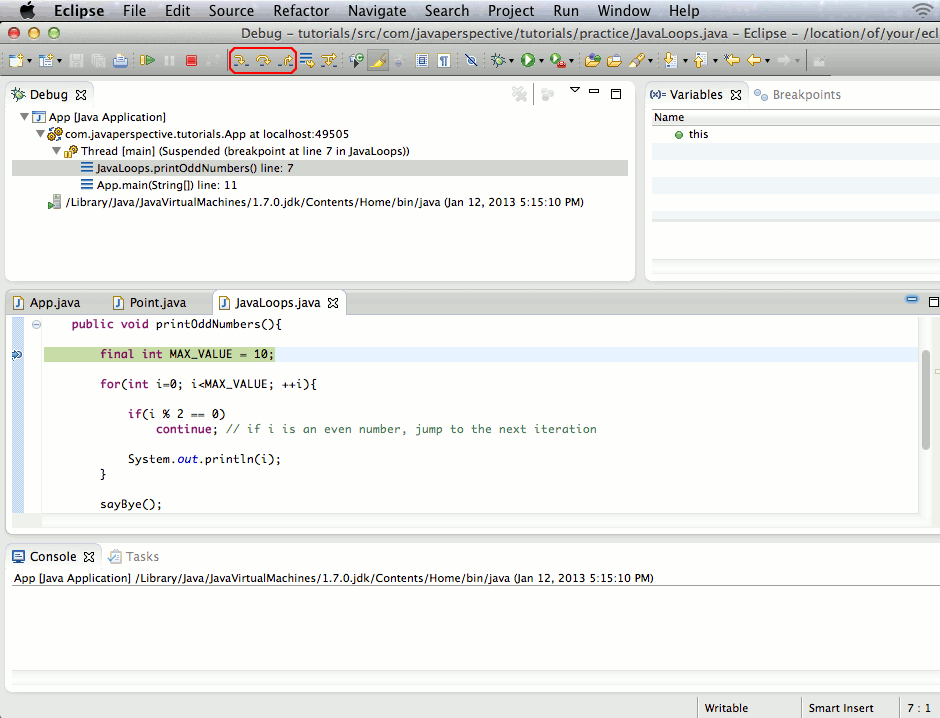
When the Debug perspective is opened, the execution is halted at the first breakpoint. The 3 buttons outlined in red in the picture below are used to step through the code as follows:
- The button Step Over in the middle executes the current statement and steps to the next statement. If there are any method calls in the current statement, those methods are not entered unless they contain breakpoints.
- The button Step Into on the left hand side enters, if any, the next method that is called in the current statement. For example, if the execution is halted at the line 17 where the method sayBye is called, clicking the button Step Into will enter the method sayBye.
- The button Step Return on the right hand side returns to the caller of the current method.
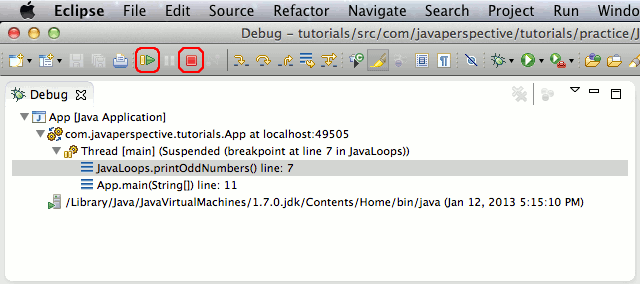
In the following picture, the buttons Resume and Terminate are outlined in red:
- The button Resume on the left hand side resumes the execution of the application.
- The button Terminate on the right hand side terminates the debugging.
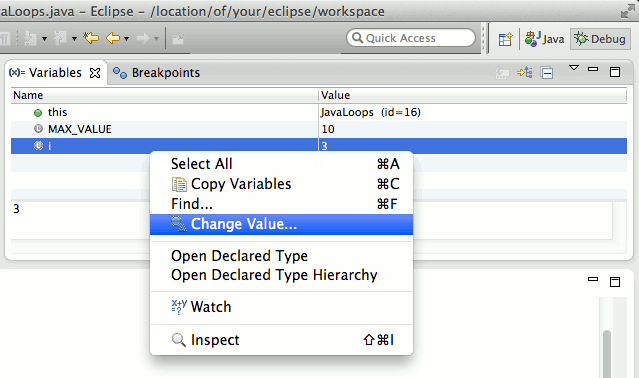
The Variables tab shown below lists the names and values of the variables that are visible in the current block. For example, if you enter the loop of the method printOddNumbers, you can see the value of the variable i. You can even change the value of the variable i on the fly. Just right-click the variable i and click Change Value:
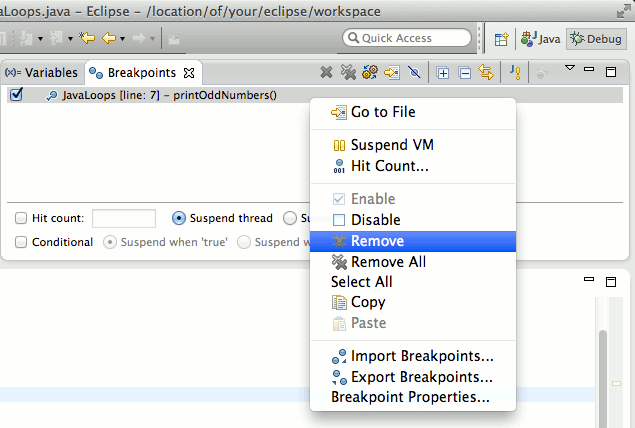
The Breakpoints tab shown below lists all the breakpoints of the current project. You can disable a breakpoint or remove it. To remove a breakpoint, just right-click it and click Remove:
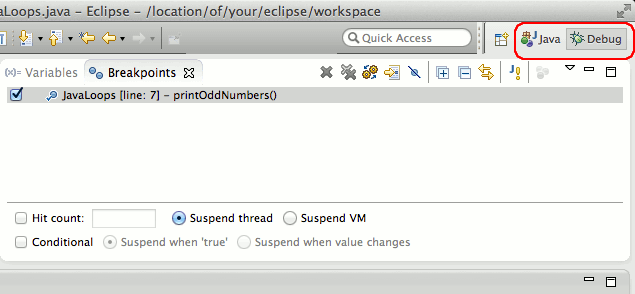
In the picture shown below, the area outlined in red shows the available perspectives. You can go back to the Java perspective by clicking the button Java:
The next tutorial will show you how to refactor in Eclipse.
You are here :
JavaPerspective.com >
Intermediate Tutorials >
1. The Eclipse IDE >
1.3. Tips about Eclipse >
1.3.3. How to use the Eclipse debugger
Next tutorial : JavaPerspective.com > Intermediate Tutorials > 1. The Eclipse IDE > 1.3. Tips about Eclipse > 1.3.4. How to refactor in Eclipse
Next tutorial : JavaPerspective.com > Intermediate Tutorials > 1. The Eclipse IDE > 1.3. Tips about Eclipse > 1.3.4. How to refactor in Eclipse
